
Wetlands Mapping
A detailed wetlands map (.5 meter) based on WorldView-2 satellite imagery is now available for the Barrow area. This information is freely available for environmental assessments and to address permitting requirements. Use the Community Planning Tool to access wetlands information and generate reports.
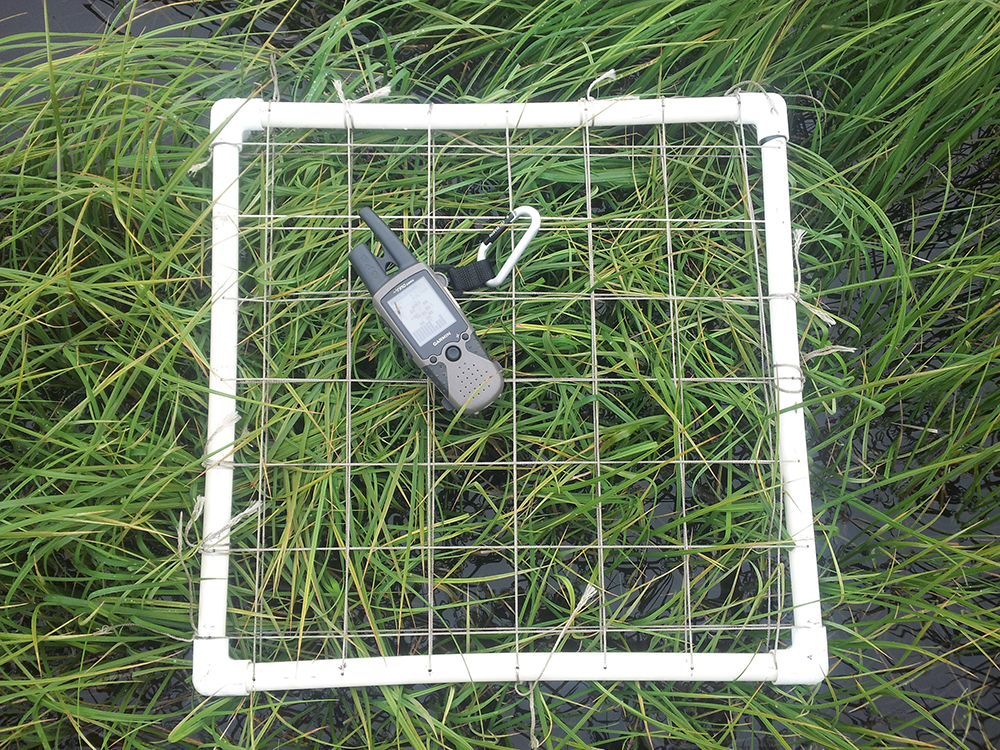
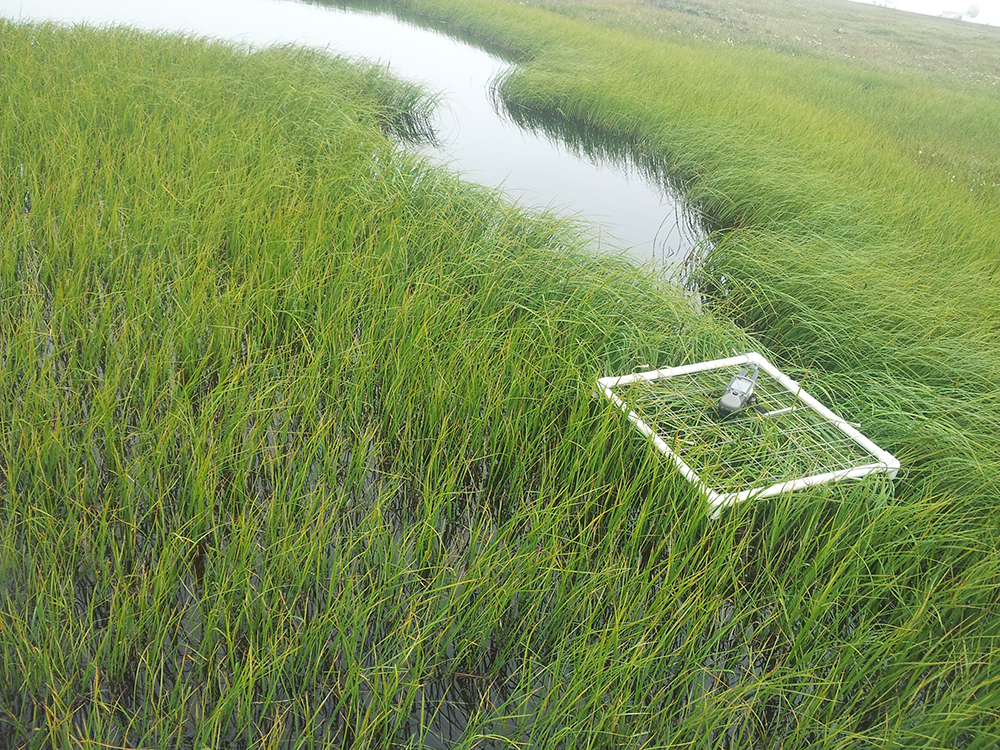 To date, over 250 ground-based vegetation plots have been established to create training classes to automatically classify the wetland categories. Distinct plant communities are sampled for the 1-meter vegetation plots and georeferenced with GPS. A narrow window (of about 2 weeks in early August) exists during the Arctic field season for capturing “peak vegetation” to create the most accurate map.
Detailed Wetlands Overview
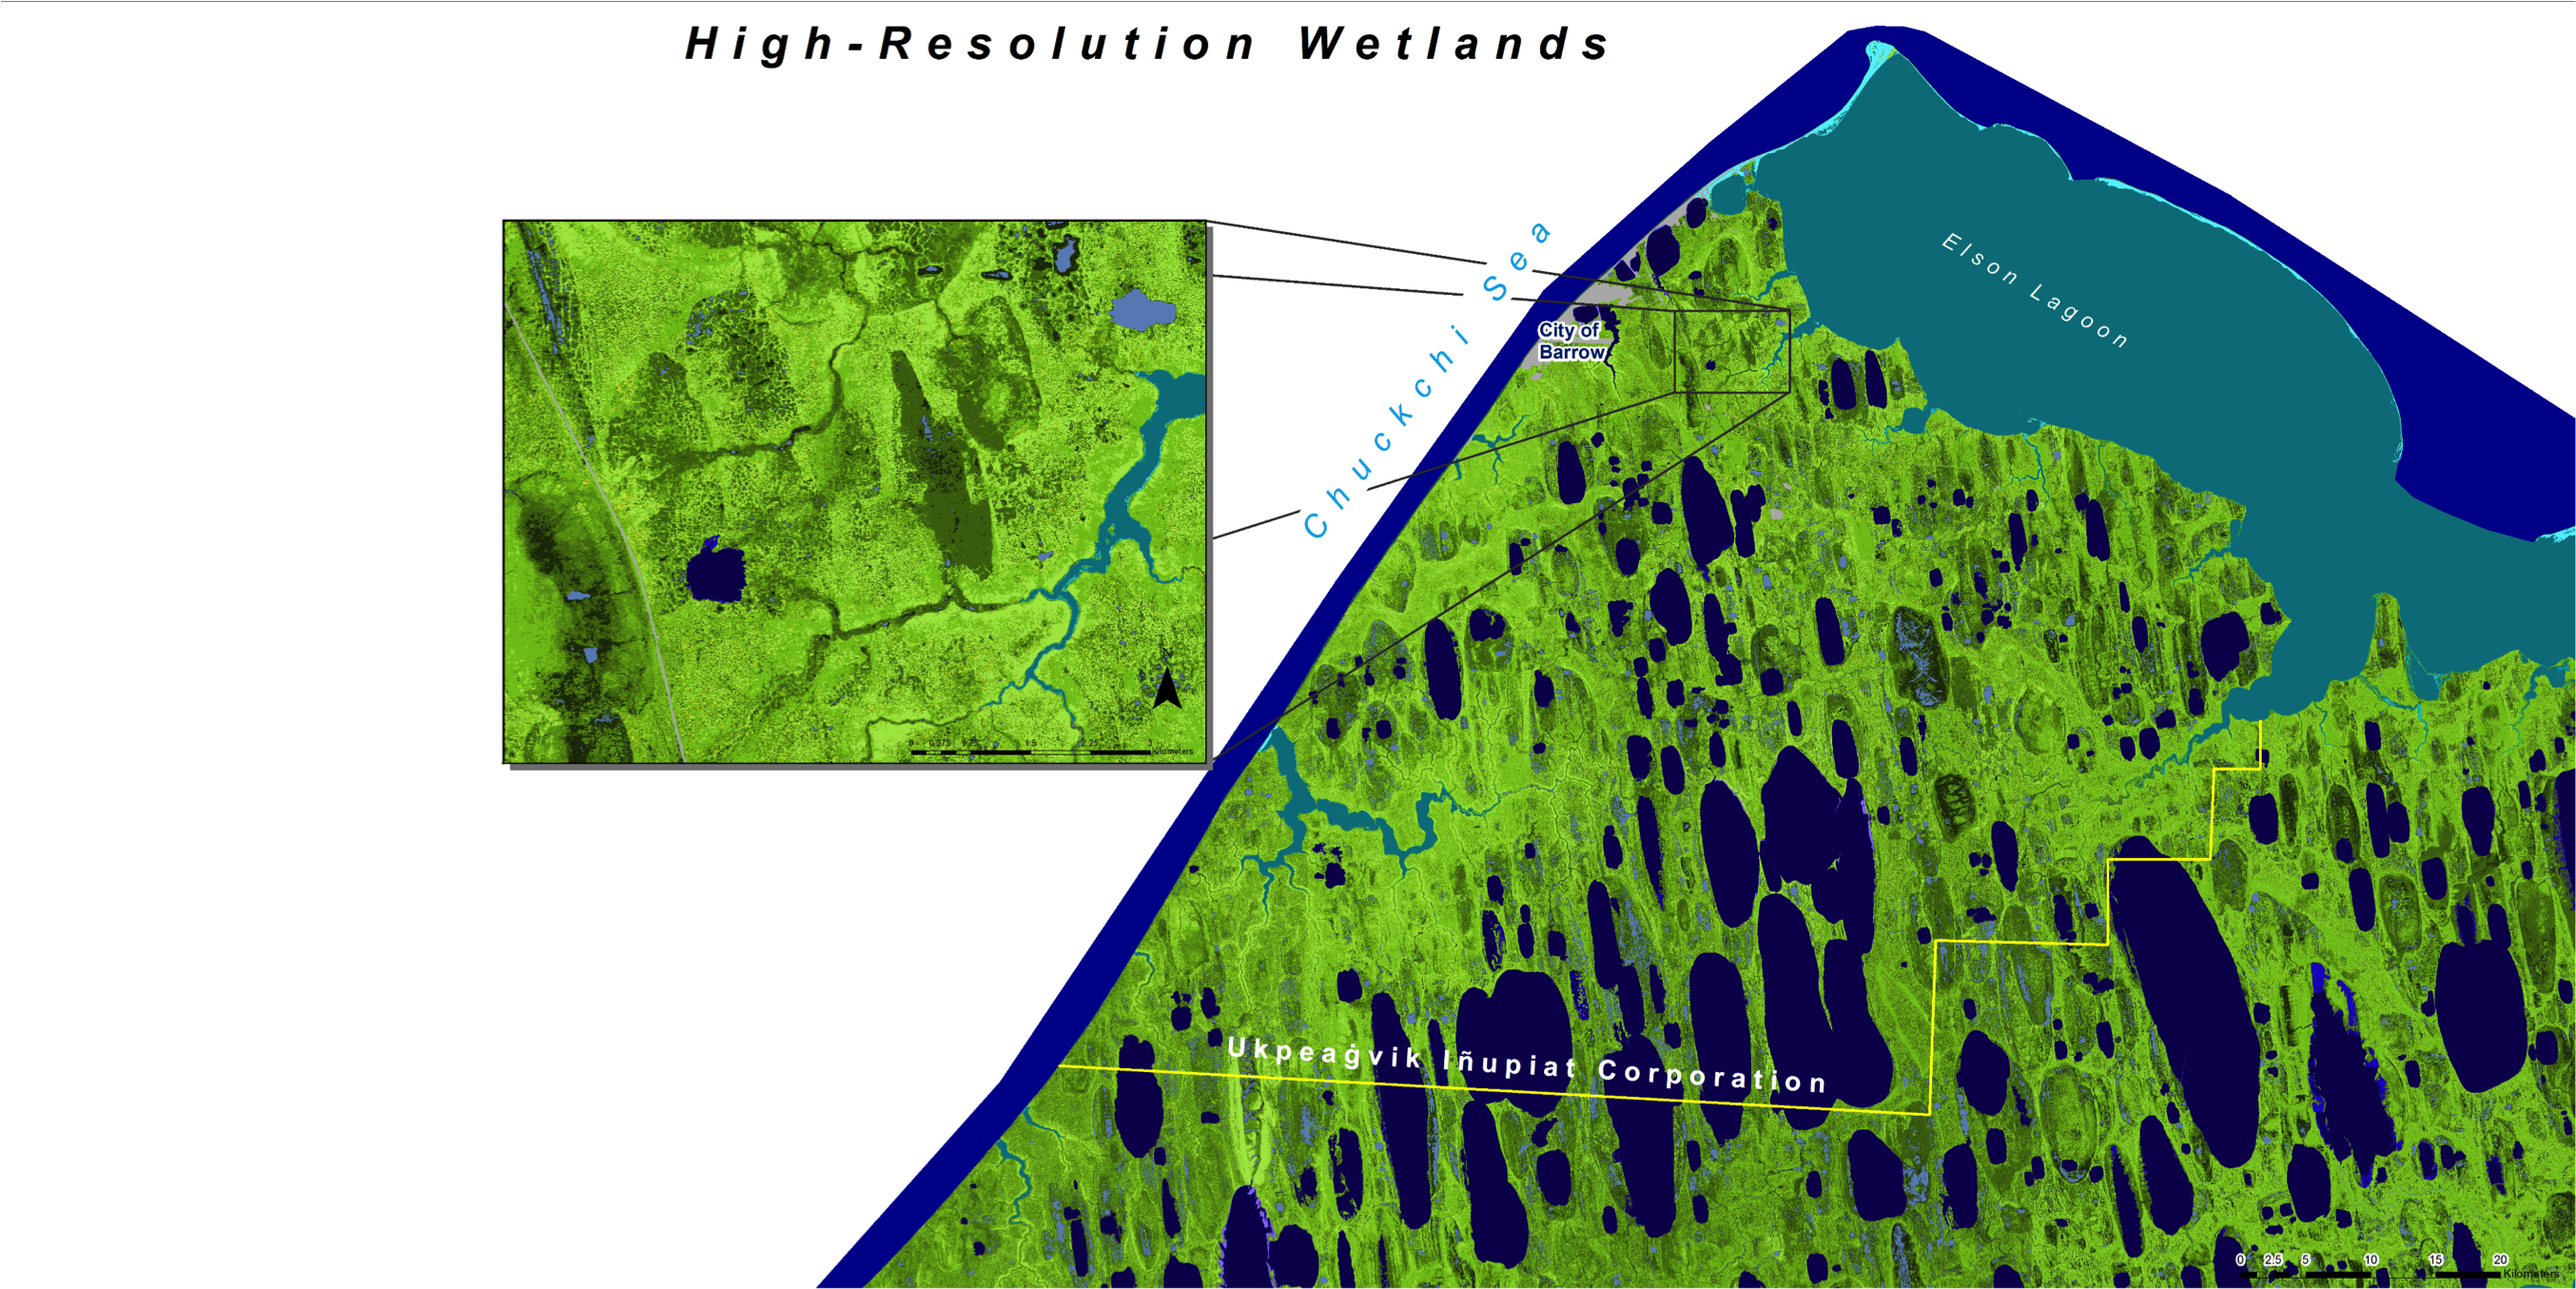
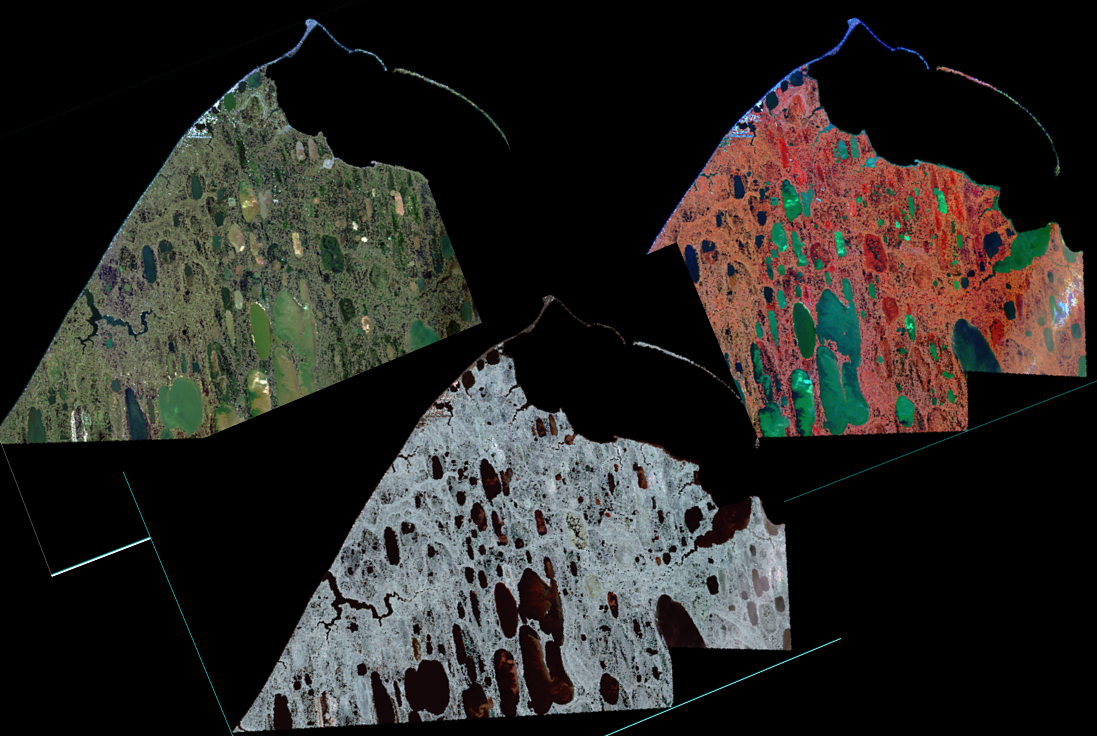
click image to enlarge
click image to enlarge
US Fish and Wildlife Service National Wetlands Inventory Code Interpreter [click here]
The Wetland Code Interpreter is a tool that will instantly provide the detailed habitat descriptions for an area represented by the wetland classification code. Enter a wetland area’s code into the interpreter and State abbreviation to obtain the classification of that wetland area as defined in Cowardin et al (1979).
Processing steps
Training site data were collected in the filed during the summer of 2013 and 2015. Soil moisture, dominant species cover, plant functional type cover, depth to permafrost, photographs, land cover formation, and high accuracy coordinates were collected spanning a transect across the Barrow Peninsula.
WorldView-2, 8-band imagery was acquired from the Polar Geospatial Center (PGC) as a set of 55 images. The multispectral and panchromatic versions of the images were fused to increase the spatial resolution from 2m to 0.5m using the Gram-Schmidt pan-sharpening method in ENVI 5.1 in order to obtain a high-resolution landcover classification. The images were mosaicked and orthorectified using Ground Control Points (GCPs) distributed across the peninsula.
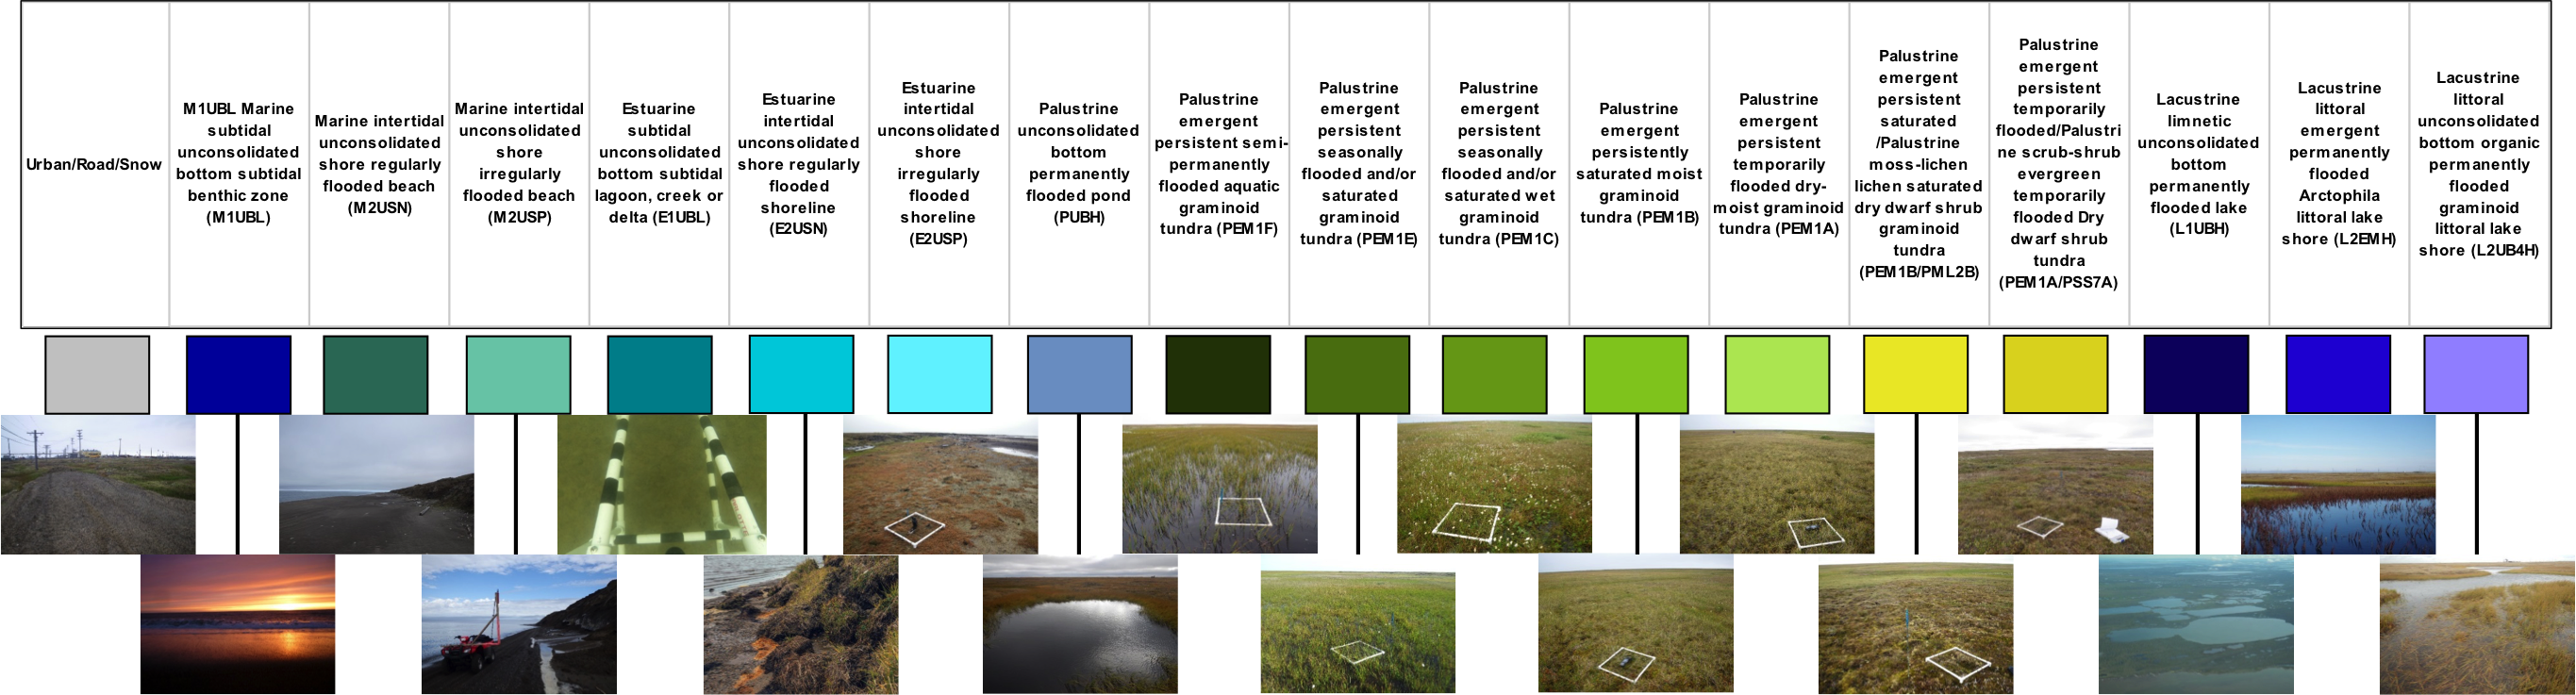
Based on Tweedie et al. (in prep) data and 2013 and 2015 field training data, a minimum-distance supervised classification was performed in ENVI 5.1. Eight original vegetation classes spanning a soil moisture gradient were derived in a landcover map. These classes include: aquatic graminoid tundra, seasonally flooded graminoid tundra, wet graminoid tundra, moist graminoid tundra, dry-moist dwarf shrub graminoid tundra, dry dwarf shrub-graminoid tundra, and dry dwarf shrub tundra. The high-resolution landcover raster and training site data were used to classify eight palustrine wetlands and bare ground. The palustrine wetlands correspond to the landcover map classes and were classified to existing NWI classes/codes based on NWI class description. Additionally, shapefiles and regions of interest (ROIs, as points) were manually drawn and selected to classify three marine wetlands, three estuarine wetlands, and three lacustrine wetlands.
The final wetlands classification used a minimum-distance supervised classification and contained a total of 18 classes (see above); nine of these classes used training site data (all palustrine wetlands and bare ground). All classes, with the exception of bare ground, were named using NWI wetland classification codes, which are a series of letter and number codes that have been developed to adapt the national wetland classification system to map form. These alpha-numeric codes correspond to the classification nomenclature (Cowardin et al. 1979) that best describes the habitat, (e.g. PFO1A). Currently there are over 7,000 code combinations in the dataset with over 14 million possible permutations of the code. For information on the wetland codes visit: http://www.fws.gov/wetlands/Data/Wetland-Codes.html
With postprocessing in ArcGIS, the wetlands layer was split into 4 tiles in the ERDAS .img format. Metadata was completed for the dataset using ArcGIS Catalog with the ISO 19139 Metadata Implementation Specification GML 3.2 metadata style, which complies with ISO 19115. A standalone browse graphic was created, and the metadata record was exported as a standalone ISO XML file along with a PDF file.
